DORA metrics demystified, turning numbers into DevOps impact
DORA Metrics: From Numbers to Action!
You’ve probably heard of DORA metrics, but what do they actually mean?
The DevOps Research and Assessment (DORA) introduced these metrics to measure DevOps performance and highlight areas for improvement.
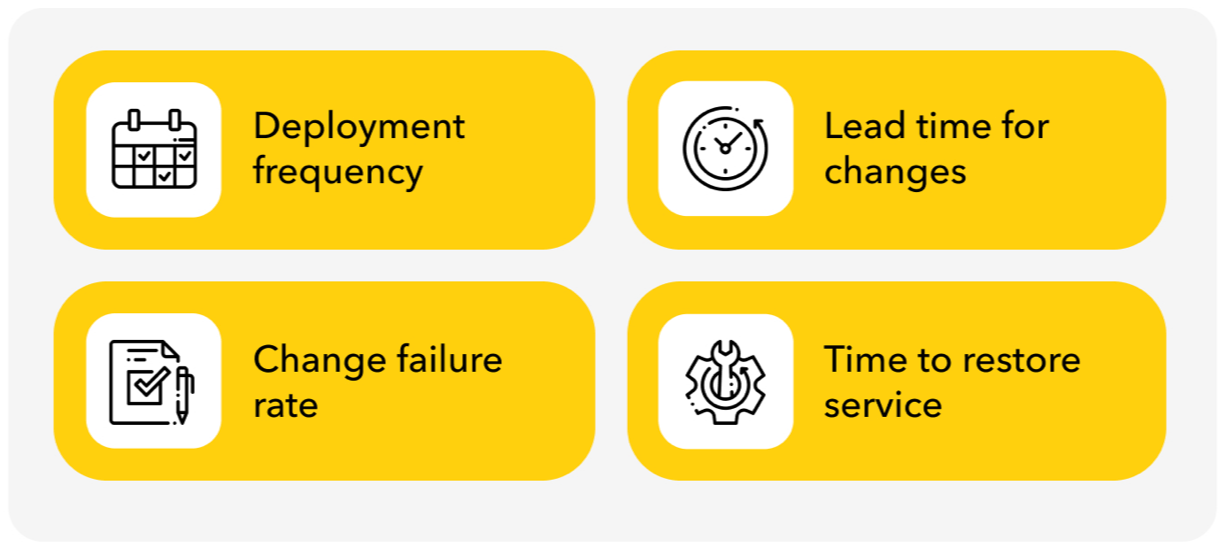
Common DORA metrics for DevOps processes
But let’s be honest — that sounds a bit abstract, doesn’t it?
Let’s simplify:
- Deployment Frequency (DF): How often does your team deploy changes to production?
- Example: 10 deployments in 7 days → DF = 1.43 (about 1–2 per day).
- Why it matters: Frequent deployments show your team can deliver value consistently and reliably.
- Lead Time for Changes (LTC): How long does it take for a commit to reach production?
- Example: Lead times of 8h, 12h, and 4h → LTC = 8 hours on average.
- Why it matters: Shorter lead times mean smoother workflows and faster delivery.
- Change Failure Rate (CFR): How often do changes fail in production?
- Example: 2 failures out of 10 deployments → CFR = 20%.
- Why it matters: A lower failure rate reflects higher deployment quality and system stability.
- Mean Time to Recovery (MTTR): How quickly does your team recover from failures?
- Example: Recovery times of 30m, 45m, and 60m → MTTR = 45 minutes.
- Why it matters: Faster recovery minimizes downtime and reduces user impact.
Metrics are only as powerful as their implementation. To truly optimize workflows, teams need more than visibility — they need actionable observability tied to these key metrics.
Turning DORA Metrics into KPIs: Measurable Goals with Real Impact
Let’s set mathematical targets for each DORA metric, showing a small and consistent improvement of 10% monthly and overall impact over six months.
1. Deployment Frequency (DF)
- Current State: 1 deployment/day
- KPI Target: +10% improvement per month
Formula: DF_new = DF_current × (1 + 0.1)⁶ Example: 1 × (1 + 0.1)⁶ ≈ 1.77 deployments/day Outcome: A 77% increase in deployment frequency over six months.
Why it matters: More frequent deployments mean continuous delivery of value.
2. Lead Time for Changes (LTC)
- Current State: 8 hours
- KPI Target: -10% improvement per month
Formula: LTC_new = LTC_current × (1 – 0.1)⁶ Example: 8 × (1 – 0.1)⁶ ≈ 4.26 hours Outcome: A 47% reduction in lead time over six months.
Why it matters: Faster delivery reduces bottlenecks and speeds up feature releases.
3. Change Failure Rate (CFR)
- Current State: 20%
- KPI Target: -10% improvement per month
Formula: CFR_new = CFR_current × (1 – 0.1)⁶ Example: 20 × (1 – 0.1)⁶ ≈ 10.5% Outcome: A 47% reduction in failure rate over six months.
Why it matters: Fewer failures mean more stable deployments and less firefighting.
4. Mean Time to Recovery (MTTR)
- Current State: 45 minutes
- KPI Target: -10% improvement per month
Formula: MTTR_new = MTTR_current × (1 – 0.1)⁶ Example: 45 × (1 – 0.1)⁶ ≈ 23.8 minutes Outcome: A 47% reduction in recovery time over six months.
Why it matters: Faster recovery minimizes downtime and user impact.
Overall Improvement After 6 Months 🚀

Boost growth and deliver bug-free releases as a team!
After six months of consistent 10% monthly improvements:
- Deployment Frequency: ↑ 77%
- Lead Time for Changes: ↓ 47%
- Change Failure Rate: ↓ 47%
- Mean Time to Recovery: ↓ 47%
Incredible! A modest 10% monthly improvement can drive remarkable results.
A team deploying 77% more frequently, with 47% faster lead times, 47% fewer failures, and 47% quicker recovery, will experience a significant boost in productivity, reliability, and delivery speed.
Would You Like to Unlock These Improvements?
Warestack is a free DevOps tool that helps teams monitor and enforce best practices across events like issues, pull requests, and deployment reviews.
Warestack empowers your team with actionable observability and automated workflows, ensuring that best practices are monitored and enforced seamlessly across issues, pull requests, and deployment reviews.
Ready to boost productivity, reliability, and delivery speed? Try Warestack for free and experience the difference firsthand.
Would You Like to Get Involved?
We’d love your help! We’re building a community hub where anyone can suggest best practices for turning observability metrics into actionable insights.
If you’re interested, request a meeting , and let’s chat!