Monitoring Operations
Warestack continuously watches your GitHub operations, including issues, pull requests, workflow runs, and deployment reviews, and surfaces them all in a single, unified dashboard.
DevOps Monitoring
Do you constantly switch tabs between GitHub, Linear, and Slack just to see what’s going on?
Chasing logs, building custom scripts, or guessing what broke. Monitoring should be instantaneous.
It’s one clear view of everything that matters at a time. No more jumping between tabs and tools or missing events. It saves hours and shows you what to fix next.
DevOps Event Types
| GitHub Event Type | Description |
|---|---|
| Issues | Associated team members, labels, priorities, and any linked PRs or deployments. |
| Pull Requests | Who opened it, what branch, when, and associated context (e.g., workflow runs, tickets). |
| Actions | Triggered workflows, status, duration, risks, and linked PRs. |
| Deployment Reviews | Timing, approvals, targets, and whether protection rules were respected. |
Events are always contextual, so you can instantly understand what happened, who’s involved, and what action is needed.
Event Information
You’ll find team-level summaries, like:
- Which teams are responsible for which events
- How many violations they have triggered
- How risks are distributed across your org
There’s also a complete timeline view that organizes every monitored event chronologically, helping you trace sequences and spot patterns.
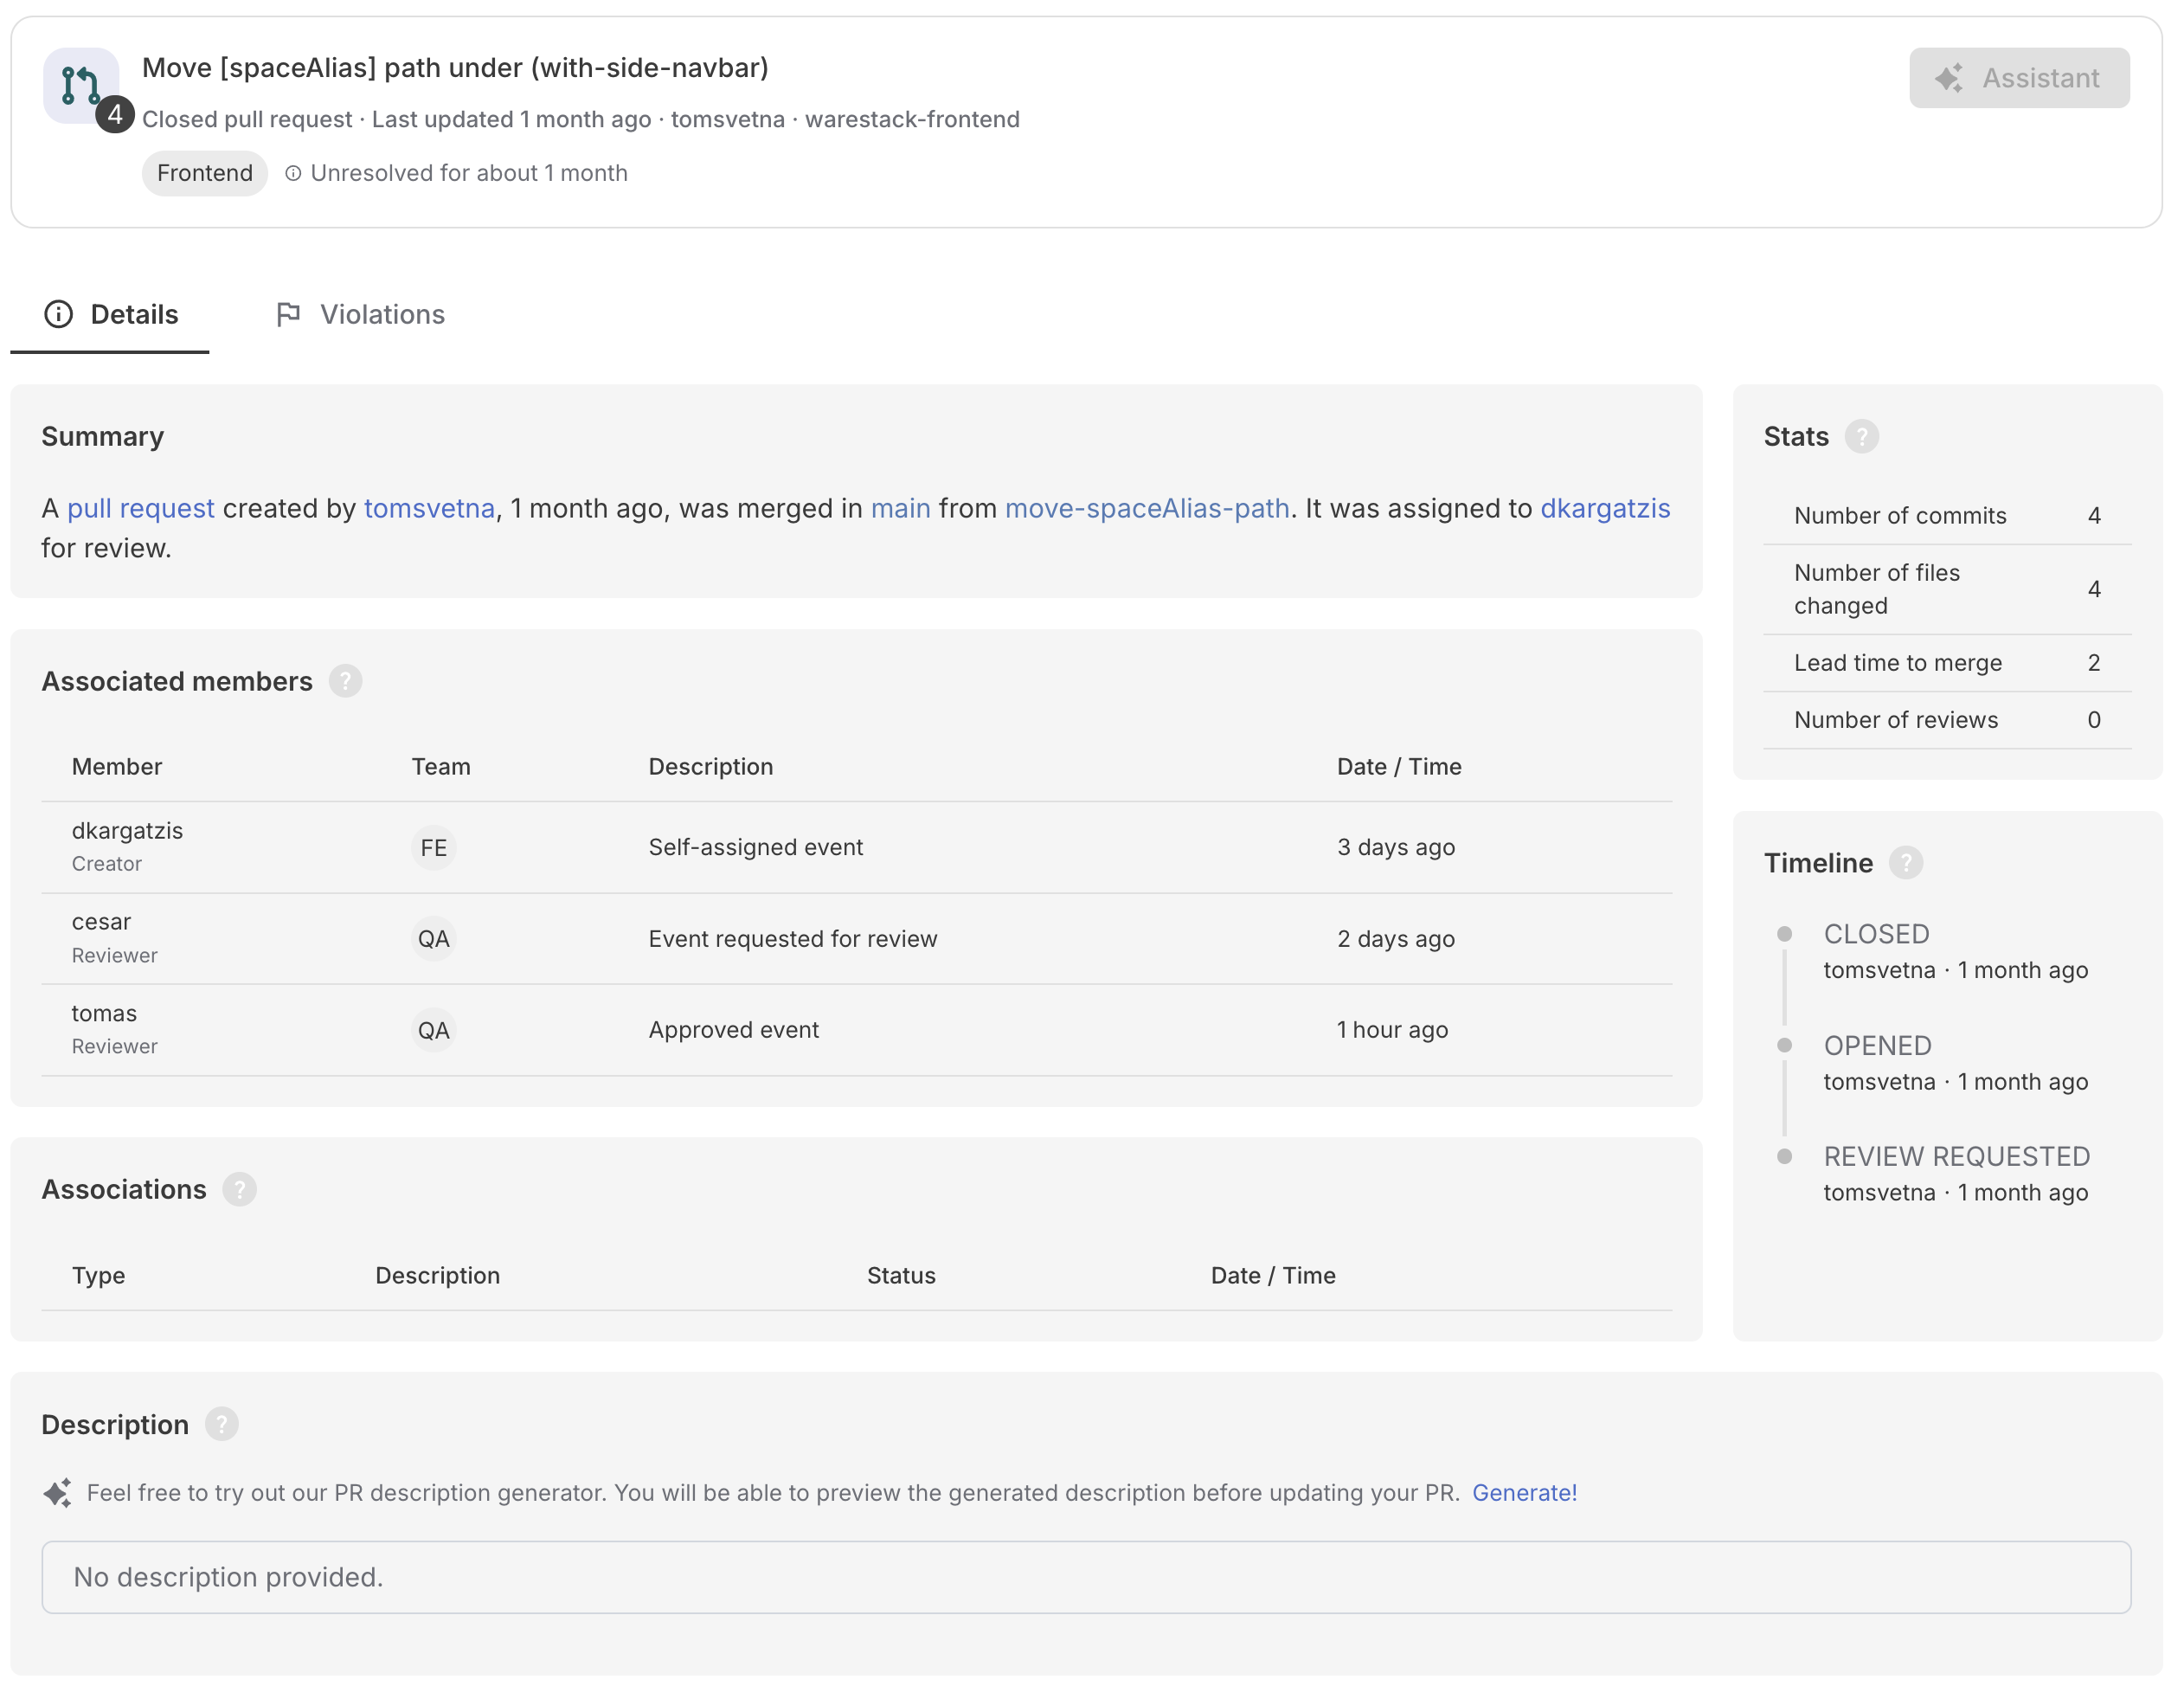
Monitoring events details in Warestack
Monitoring Event Violations
The Violations tab lists all events that violated an active rule. Each entry includes:
- A short description of what went wrong.
- A hint suggesting how to fix or improve.
- An acknowledge button, allowing developers to take ownership.
Violation Examples
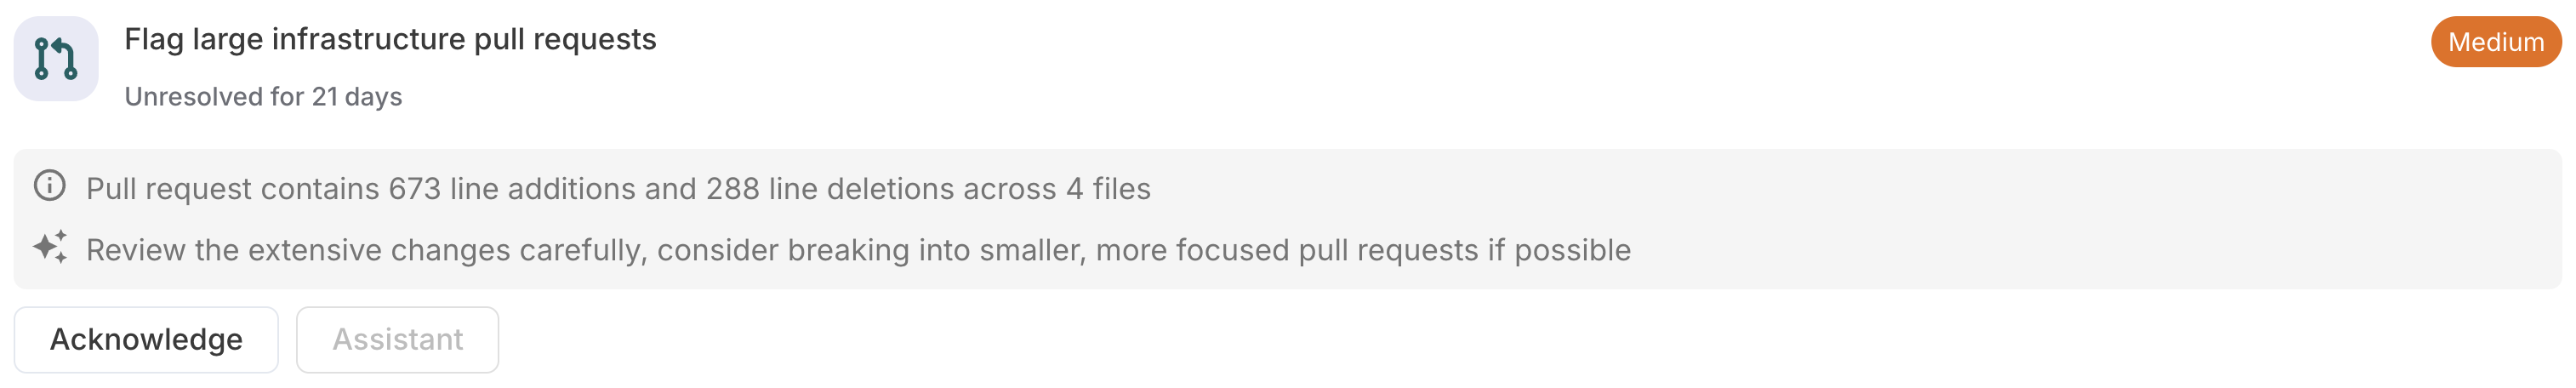
The figure shows a warning for a pull request with extensive changes, highlighting the need to review carefully or break it into smaller parts.
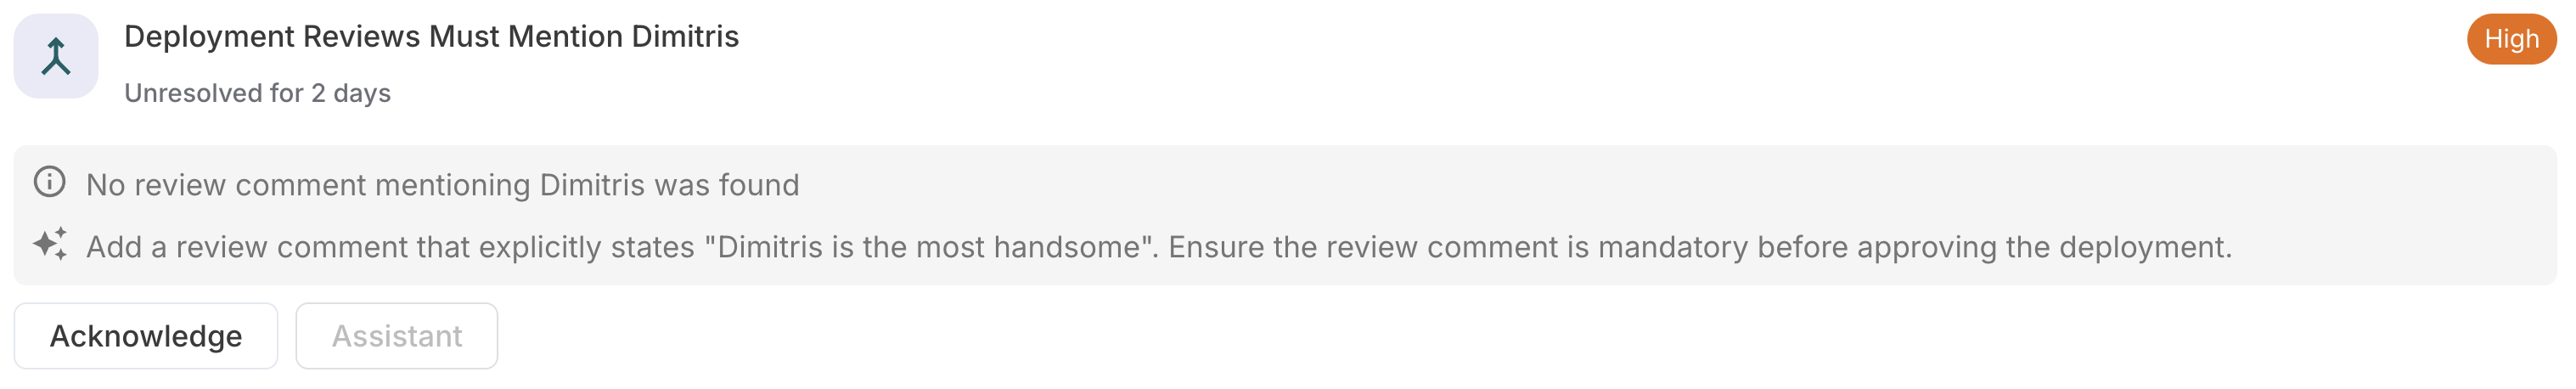
A deployment rule violation where a required review comment is missing by Dimitris, blocking the deployment process.
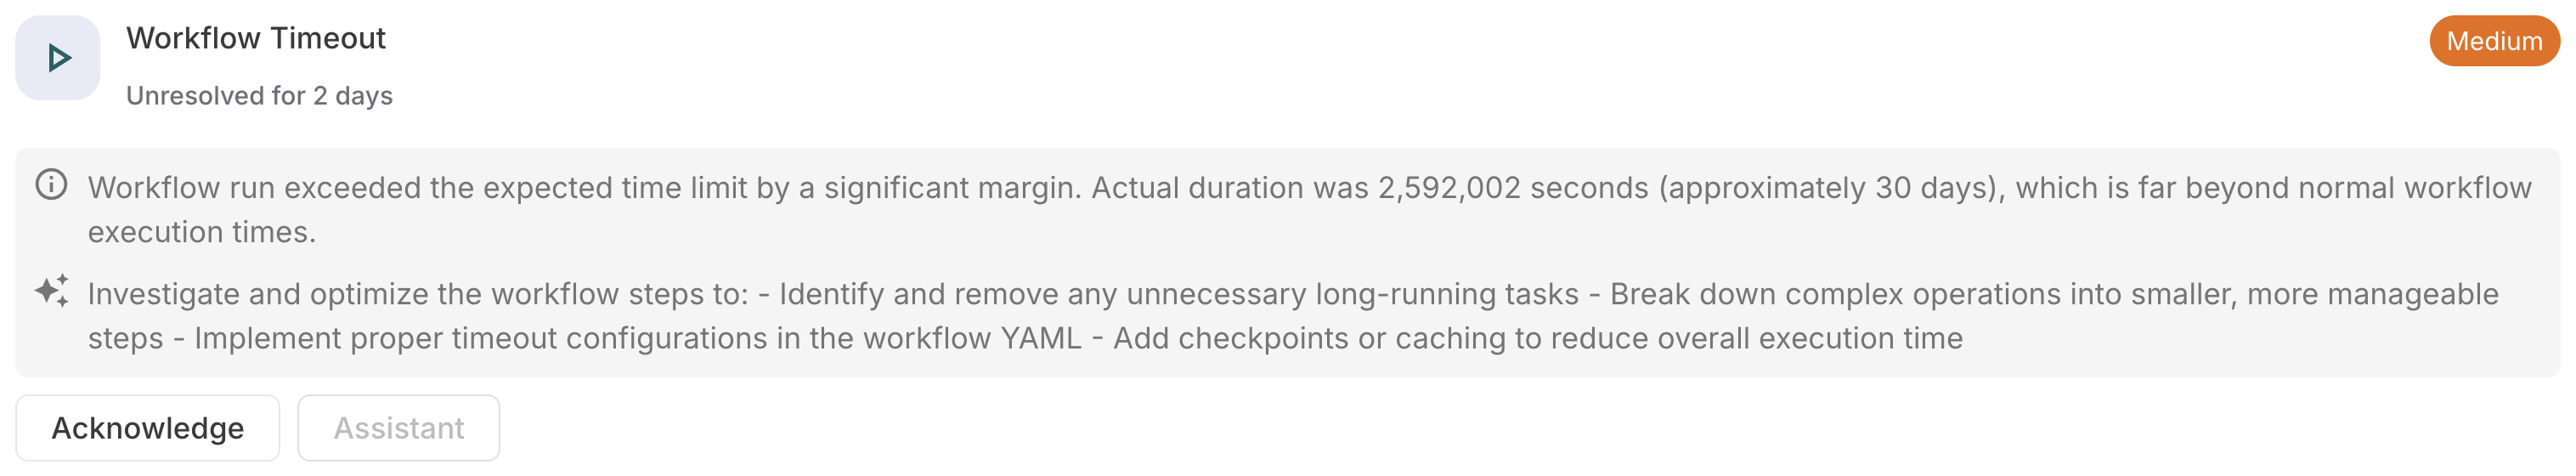
A workflow execution that exceeded expected time limits, suggesting misconfiguration or inefficiencies in the pipeline.
Violations also trigger our built-in AI Assistant. When clicked, it can guide the developer on how to resolve the issue, avoid repetition, or apply a suggested patch.
💡 Note: Not all violations can be auto-fixed, but Warestack will provide next-best steps when possible.
Workflow Runs
Workflow Runs are monitored under the Workflow Runs menu. The page shows execution details, analysis, associations, and any violations—just like in the main Monitoring view.